TD Regression Watch 006//RG
Players whose touchdown totals sit far above or below what their volume alone would predict, using the league-wide scoring rate of 0.0407 TDs per touch (2021–2025, minimum 50 touches). This is a screen, not a verdict — some players beat the league rate every year because their team hands them the ball at the goal line by design (Jalen Hurts and the Eagles' short-yardage QB sneak is the textbook case), so treat each name as a starting point for a closer look, not a conclusion.
Running hot — candidates to cool off
Scoring well above volume expectation. Unless there's a structural goal-line role behind it, TD rates this far above the league norm tend to come back to earth.
| Player | Touches | Actual TDs | Expected TDs | Above expected |
|---|---|---|---|---|
|
JH
|
800 | 70 | 32.6 | +37.4 |
|
JA

|
672 | 62 | 27.4 | +34.6 |
|
ME

|
613 | 51 | 25.0 | +26.0 |
|
DA

|
818 | 56 | 33.3 | +22.7 |
|
JC

|
858 | 57 | 35.0 | +22.0 |
|
GK

|
479 | 40 | 19.5 | +20.5 |
|
TH

|
553 | 42 | 22.5 | +19.5 |
|
CK

|
654 | 43 | 26.6 | +16.4 |
|
MA
|
512 | 37 | 20.9 | +16.1 |
|
GD
|
327 | 29 | 13.3 | +15.7 |
|
DM
|
617 | 40 | 25.1 | +14.9 |
|
TK
|
768 | 46 | 31.3 | +14.7 |
|
DK

|
292 | 26 | 11.9 | +14.1 |
|
JG
|
971 | 53 | 39.6 | +13.4 |
|
AB
|
689 | 41 | 28.1 | +12.9 |
Running cold — candidates to heat up
Heavy volume, light scoring. If the role holds, touchdown luck this poor usually corrects.
| Player | Touches | Actual TDs | Expected TDs | Below expected |
|---|---|---|---|---|
|
AK

|
1360 | 28 | 55.4 | -27.4 |
|
TP
|
1400 | 32 | 57.0 | -25.0 |
|
NH
|
1386 | 34 | 56.5 | -22.5 |
|
AJ
|
1283 | 33 | 52.3 | -19.3 |
|
JW
|
786 | 14 | 32.0 | -18.0 |
|
SB

|
1780 | 55 | 72.5 | -17.5 |
|
JW

|
1121 | 29 | 45.7 | -16.7 |
|
DS
|
1300 | 38 | 53.0 | -15.0 |
|
MC
|
614 | 10 | 25.0 | -15.0 |
|
CH
|
1097 | 30 | 44.7 | -14.7 |
|
DC
|
744 | 16 | 30.3 | -14.3 |
|
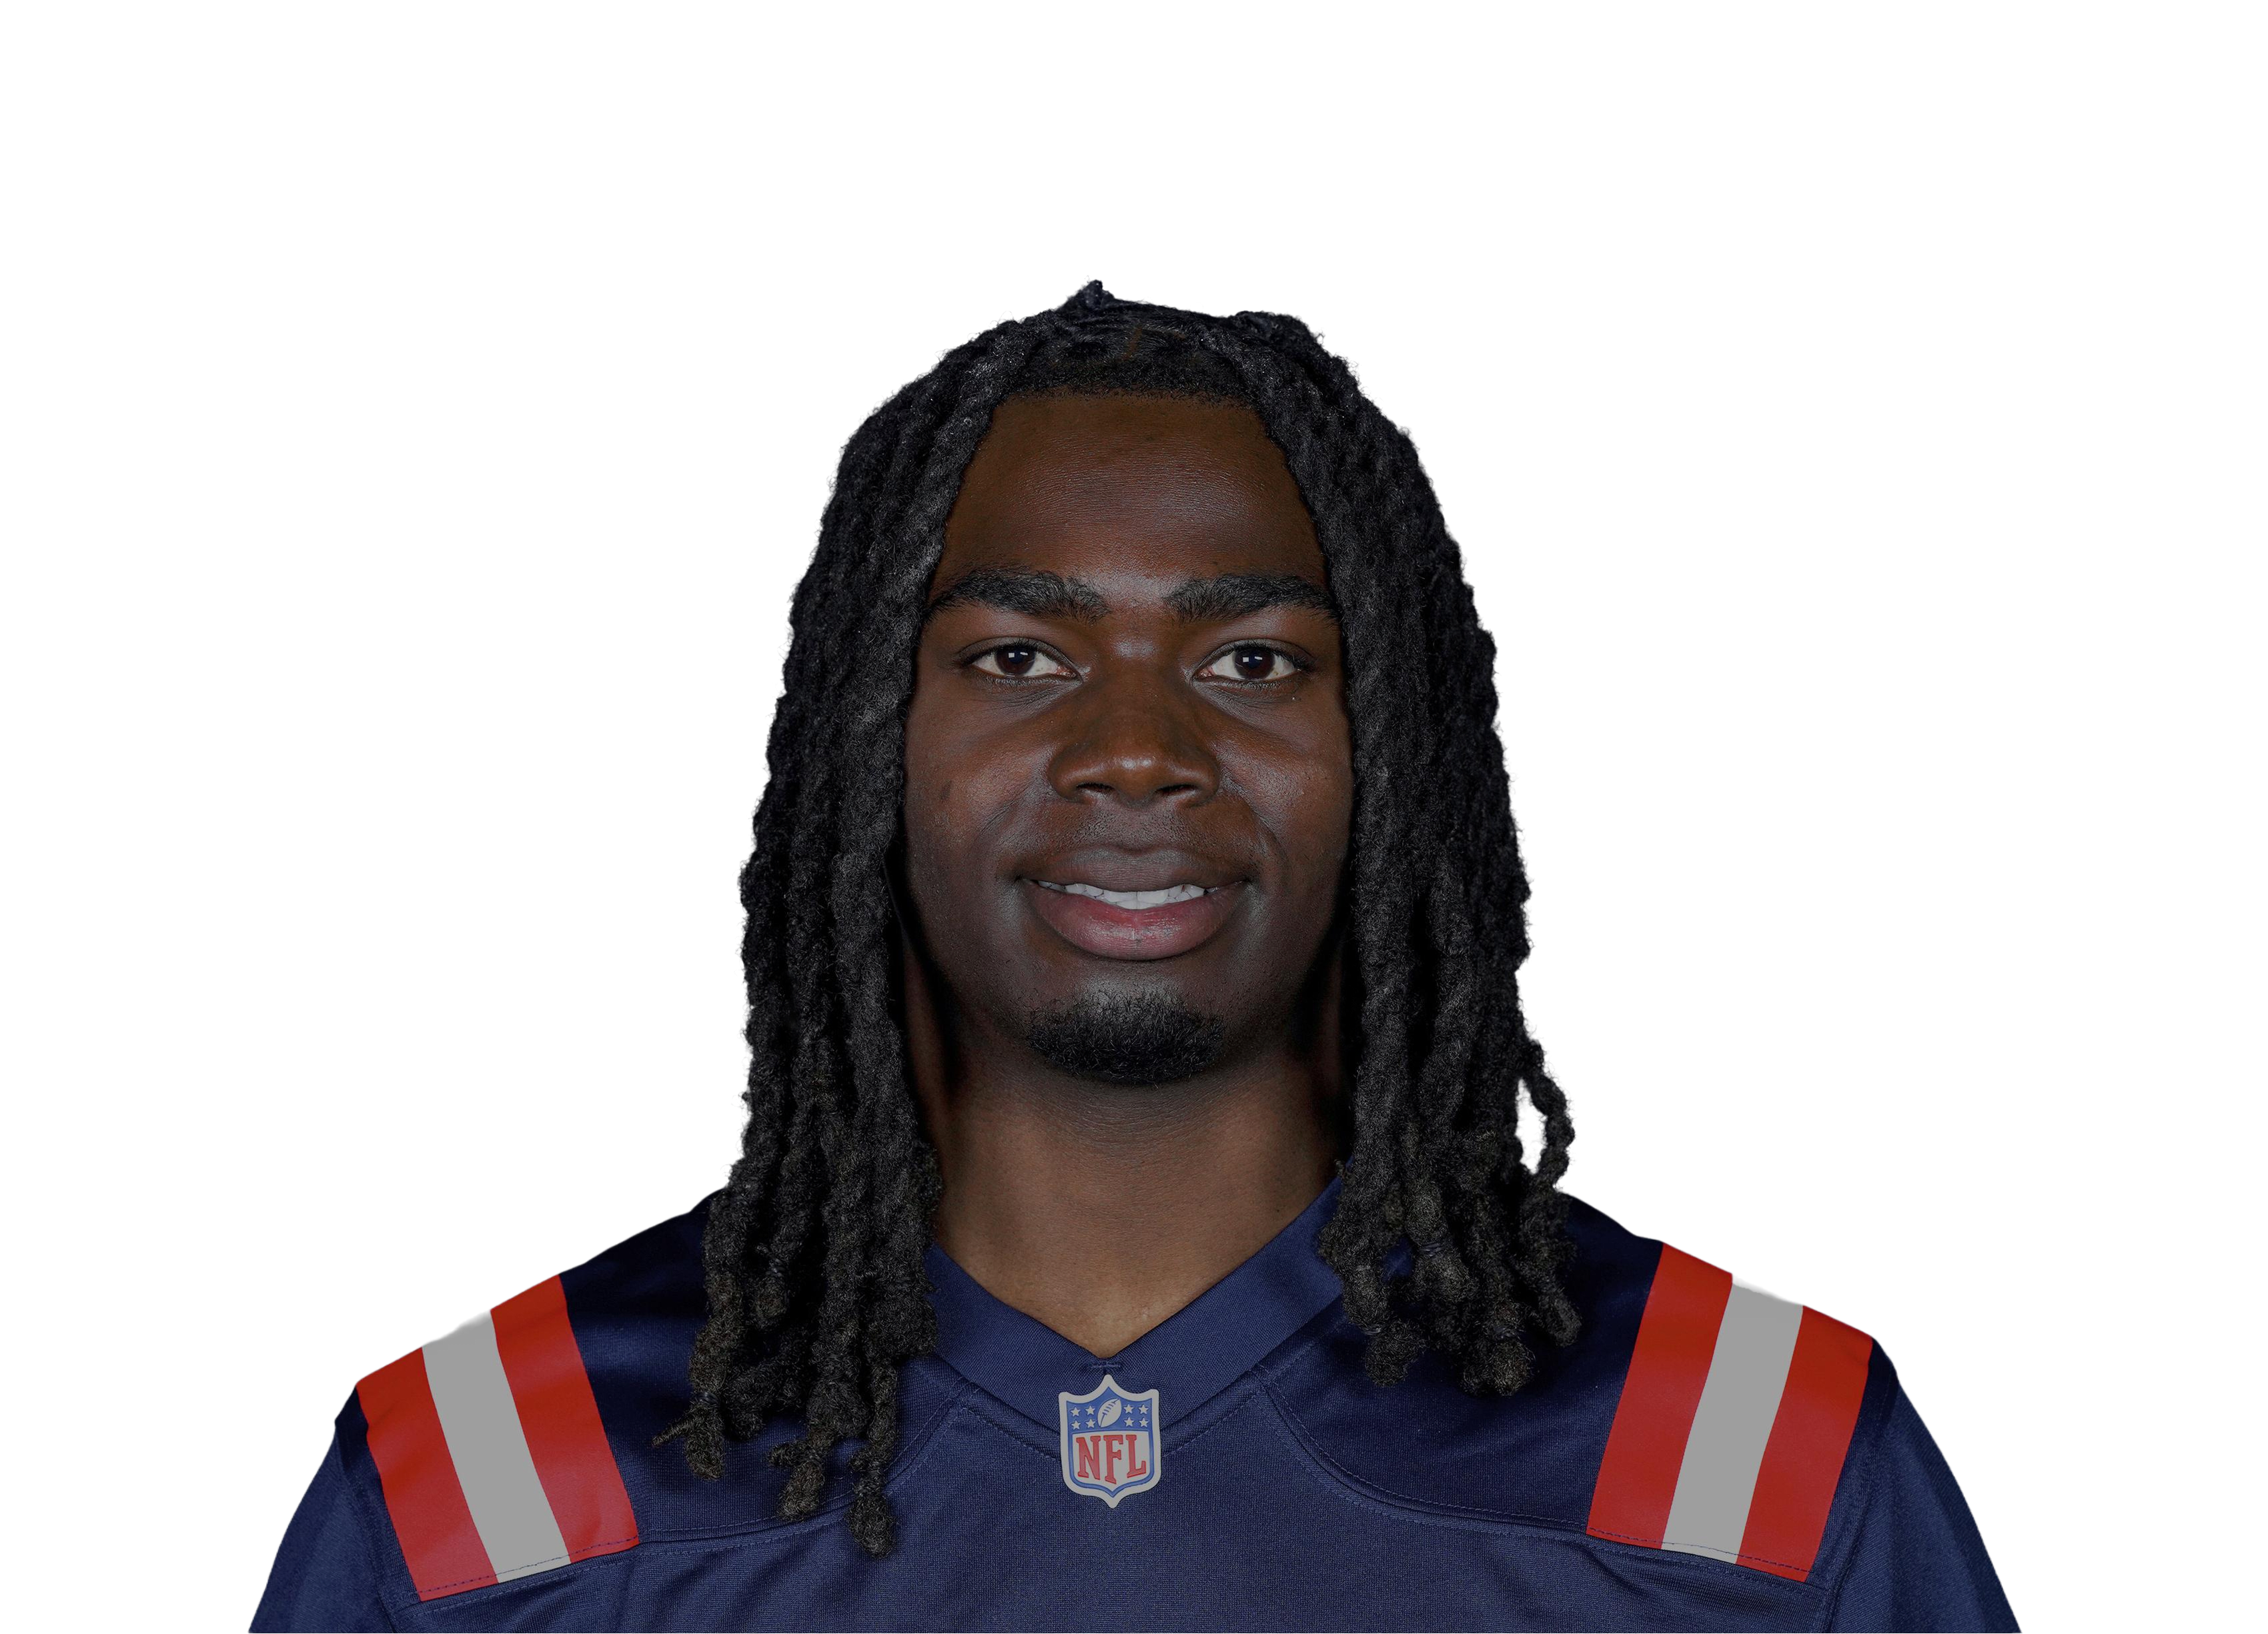
RS
|
1156 | 33 | 47.1 | -14.1 |
|
MS
|
786 | 18 | 32.0 | -14.0 |
|
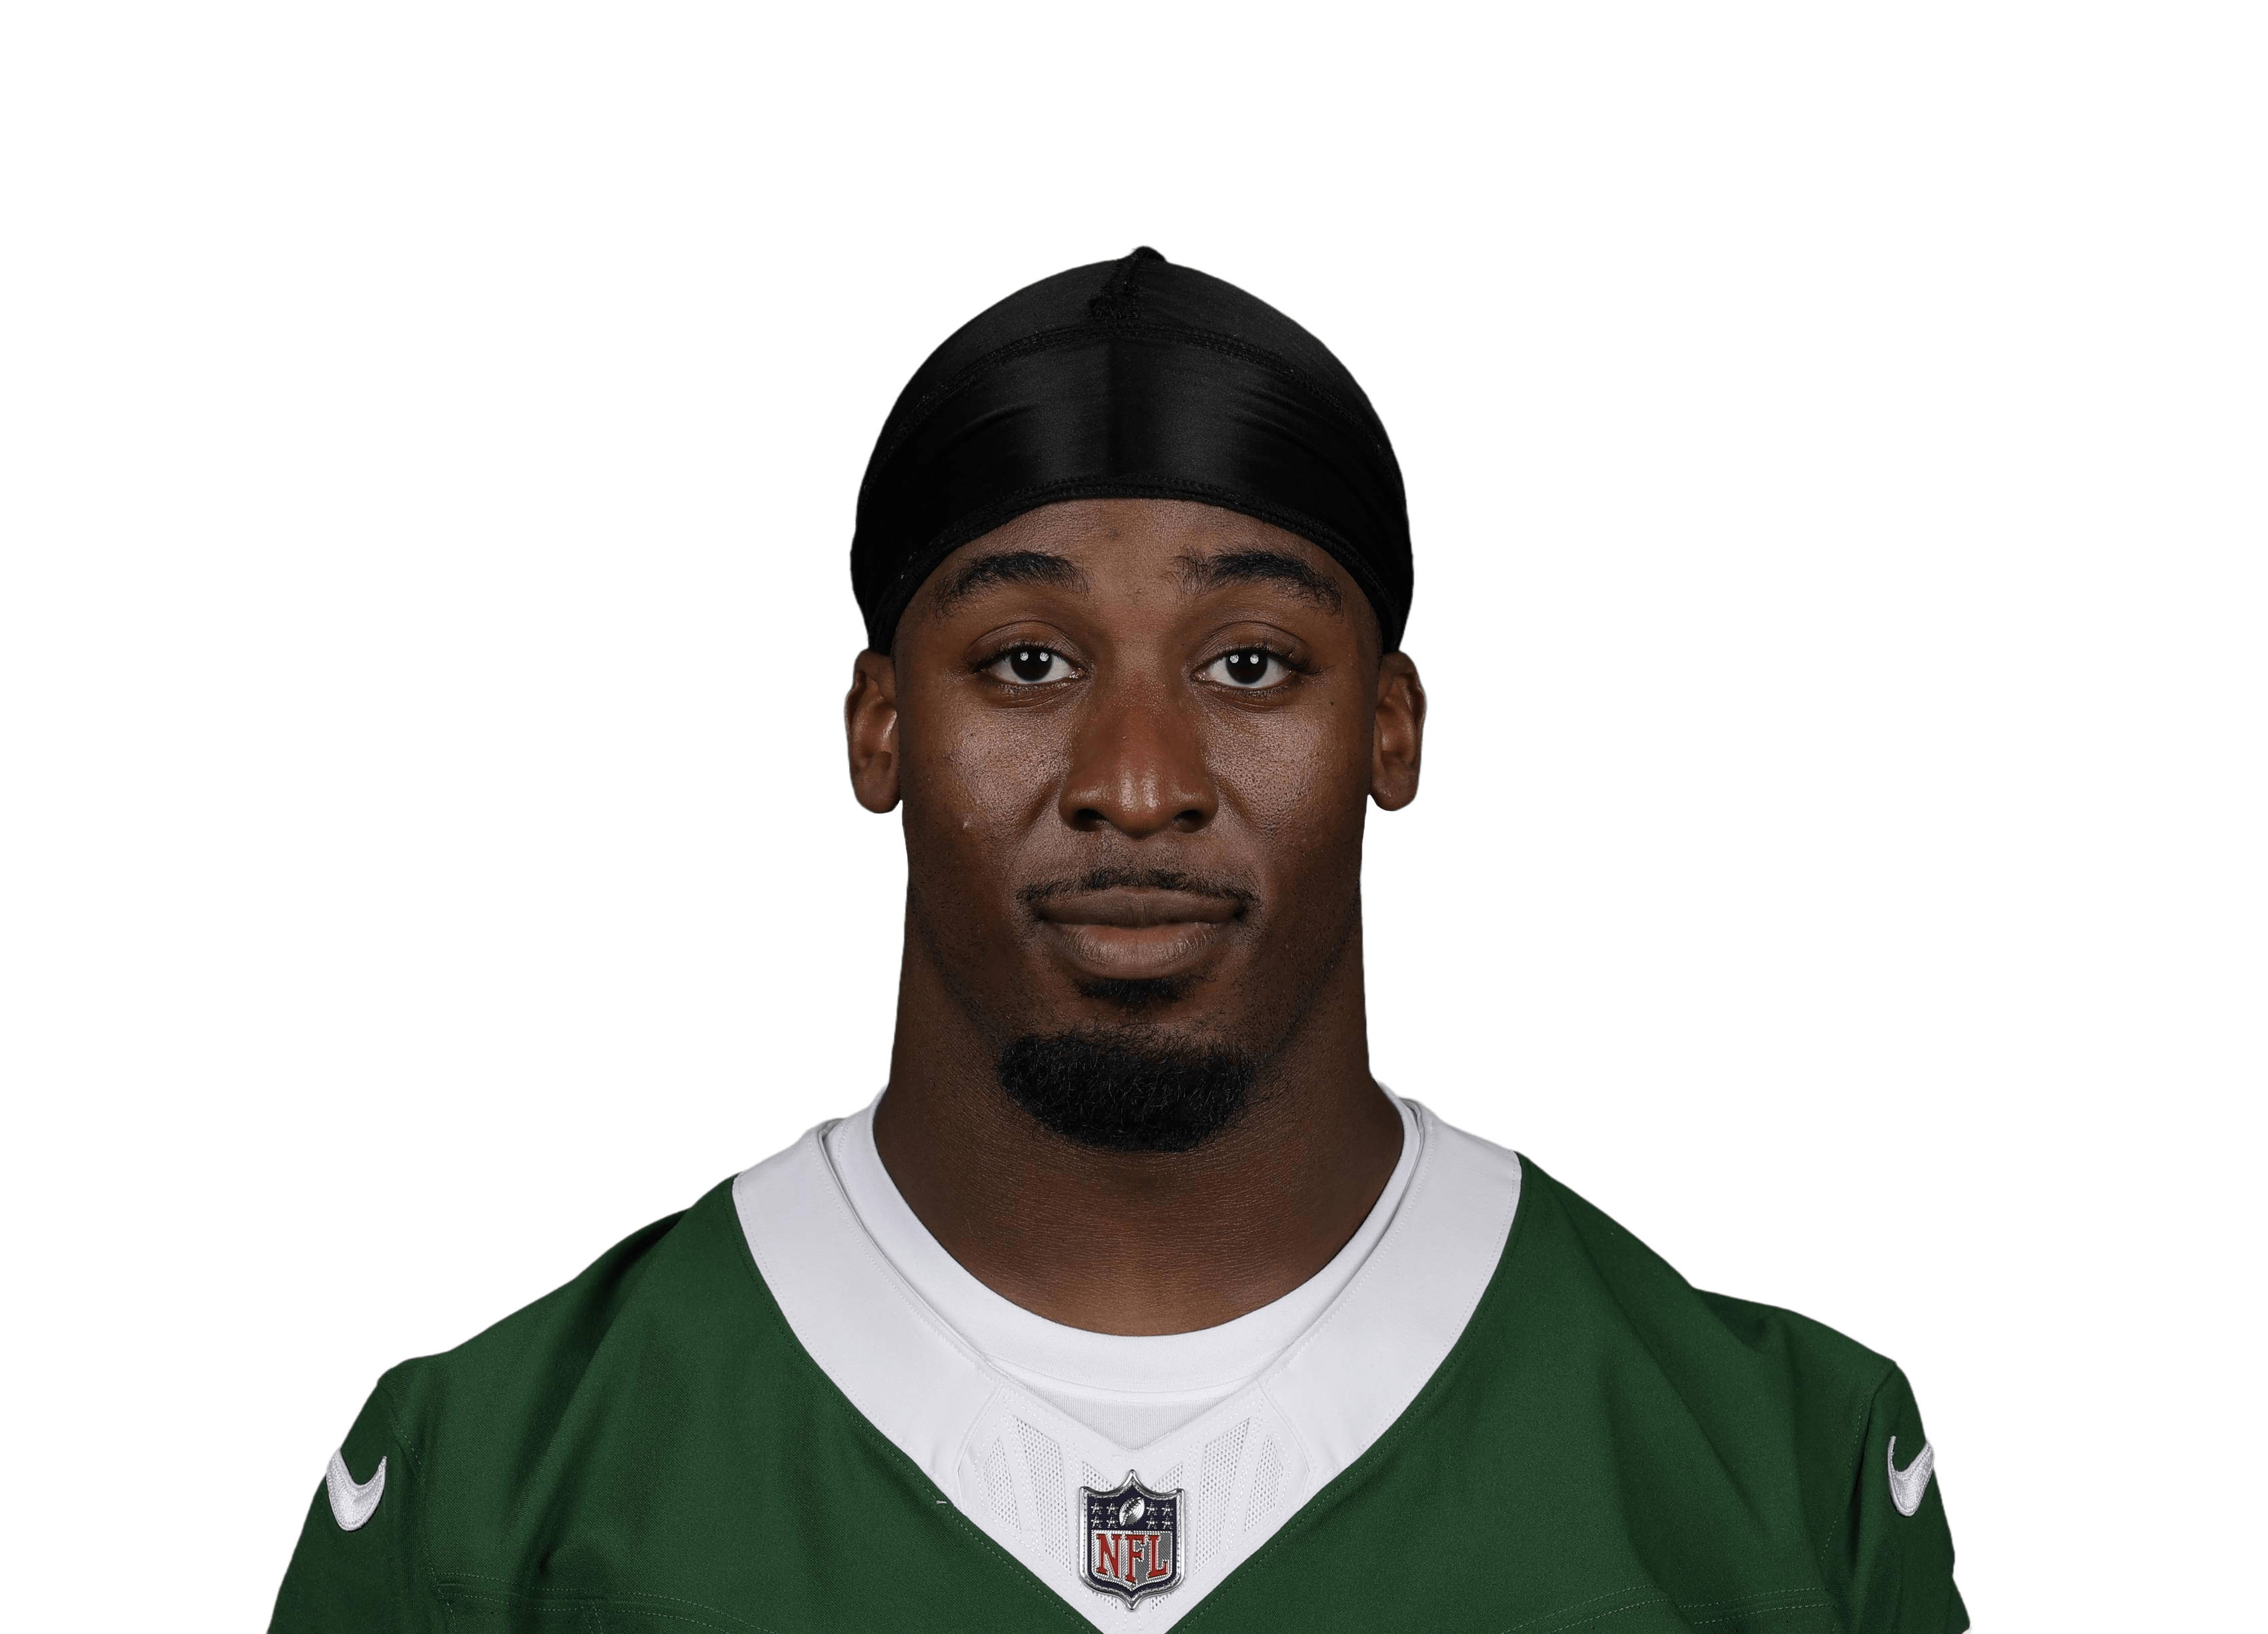
BH
|
1005 | 27 | 40.9 | -13.9 |
|
TE

|
1168 | 34 | 47.6 | -13.6 |
Expected TDs = touches × the 2021–2025 league-average TD rate per touch. A deliberately simple, transparent yardstick — it doesn't know about goal-line roles, scheme, or matchup, which is exactly why its outliers deserve a second look rather than blind faith.